A year of local economies in motion: what people bought, how merchants grew, and the way work reshaped itself around both.
Figures below are drawn from aggregated and anonymized DoorDash consumer orders and Dasher and merchant activity, supplemented by public data from sources such as the Bureau of Labor Statistics and the U.S. Census Bureau. Where available, results reflect the city you choose in the header.
Restaurant price increases are easing, down from 3.5% growth a year ago to 3.1% this year.
Everyday prices look flat overall, but categories are diverging: eggs are down, ground meat is up, and electronics are split.
Office orders are up year-over-year in a majority of the 100 largest cities, not only in major metropolitan areas but also smaller cities like Laredo, TX and Chandler, AZ.
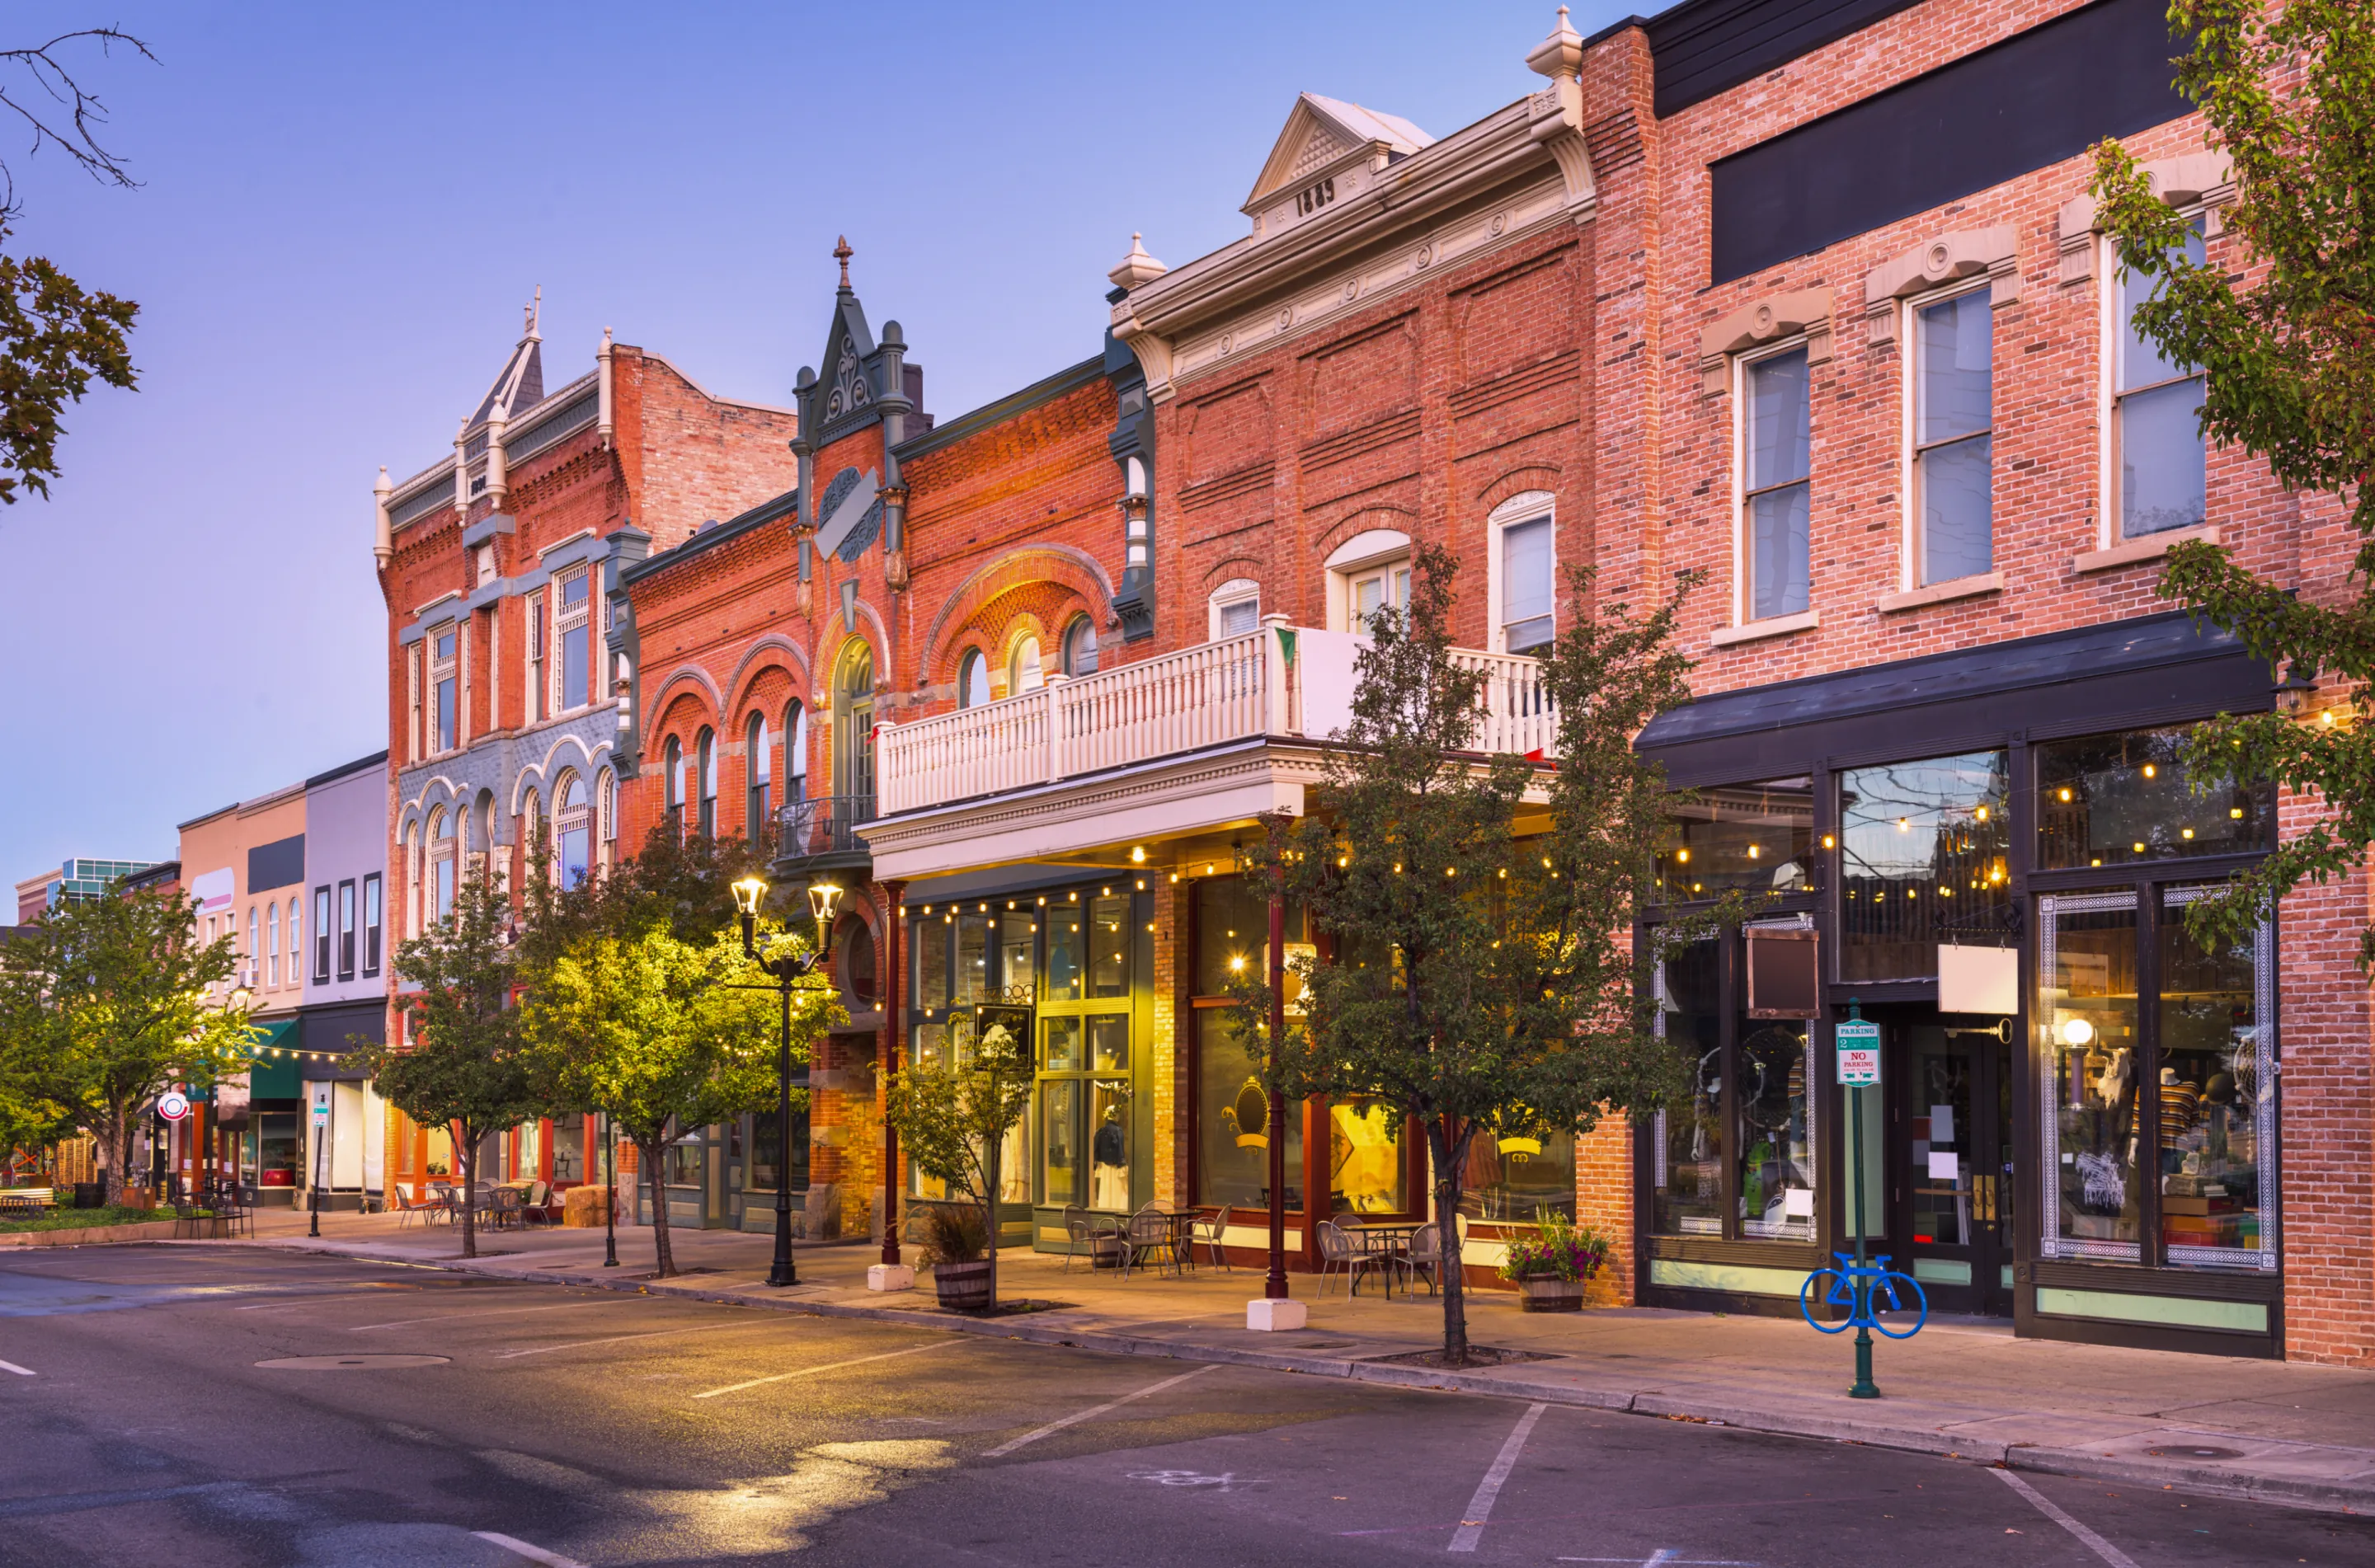
Main Street is holding strong, with nearly 93% of restaurants on the DoorDash platform remaining open for business over the past year.
For full methodology, go here for the full report.
Where local trends are emerging on prices, baskets, and the everyday trade-offs households made this year.
More than just restaurants
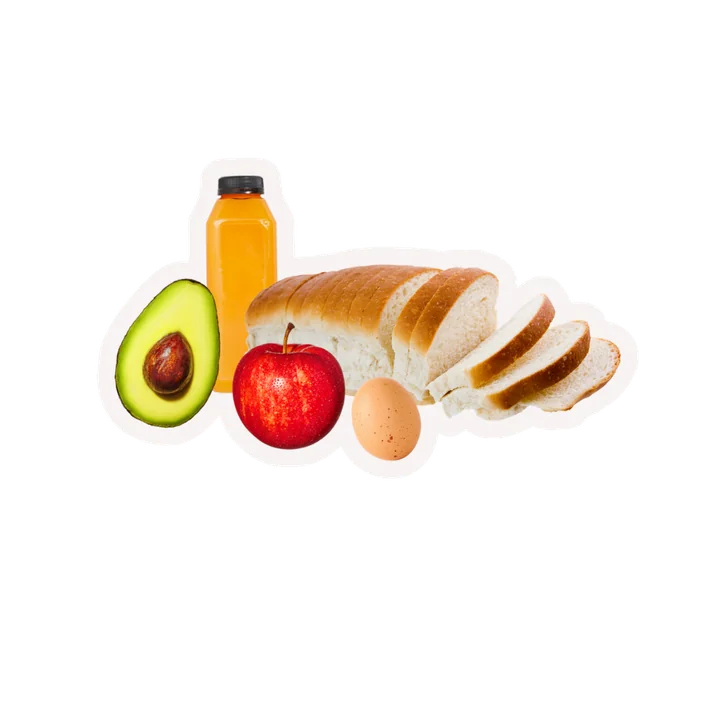
Average cost of breakfast groceries has dropped 6.0% over 12 months, with eggs leading the price drop
Average cost of typical household goods is relatively flat over the past 12 months
Year-over-year change in Restaurant Price Index
September 2025 to September 2026
Source: Bureau of Labor Statistics, Usual Weekly Earnings of Wage and Salary Workers.
Due to the federal government shutdown, Q4 2025 data is missing from BLS.
Data is indexed to January, 2025
2025 compared to 2024
Wage growth = RPI growth
The difference between the fixed and floating price indices can provide insight into how much people are substituting toward (or away from) cheaper items. Between April and September 2026, the floating price index was below the fixed price index, meaning people were trading down and ordering less expensive meals.
Total
Food
Spend
Year-over-year growth

Total
Restaurant
Spend
Year-over-year growth

Total
Grocery
Spend
Year-over-year growth

Source: U.S. Census, Advance Monthly Sales for Retail and Food Services, September 2025 to September 2026.
19.1%
average rate of local restaurants opening new doors to growth with DoorDash
92.7%
of restaurants on DoorDash remained open twelve months later nationally
Some cities are bringing downtowns back.
How work is changing
On average, Dashers spend approximately 4 hours per week delivering, with most having full- or part-time jobs outside dashing. Here's what they do:
How work is changing
Dashing patterns vary by age: Dashers 65 and older are nearly twice as likely to dash at 6 a.m. and remain above average through noon, while younger Dashers tend to pick up extra hours during spring break.
Online hours per Dasher per month
Relative likelihood of dashing in each hour
Hour of day
Relative likelihood measures how age groups of Dashers prefer different time periods to dash, relative to other age groups.
DoorDash data shows where people move
People that movedyour city in
More people are moving across state lines, while fewer are just moving across town. Moves from your city:
Use the left and right arrow keys to read out each shaded state, Home and End for the first and last, and Escape to put it away.
"Move" is defined as establishing a new frequent delivery address; see methodology in report for more detail.
DoorDash data offers a unique perspective at a granular level, down to the city and the basket, and offers a look at emerging trends.
In cities across the country, AI-powered discovery on DoorDash is helping consumers find and support the local businesses around them.
Consumers can use the AI-assisted Ask DoorDash feature to help discover new merchants and build more complex grocery carts, by telling it “I want pasta and a gluten-free dessert” or “Build this viral salad recipe under $30”. This chart measures the likelihood of using AI to assist cart building by geography (100 = average, 200 = 2x likely).